high mix manufacturing


CalAmp, Inc.

  DEHART CONSULTING, INC.'s flow-based manufacturing methods enabled California Amplifier to significantly reduce floor space, manufacturing cycle-time, and overhead staffing requirements, reduce our material costs by nearly 20%, while over tripling California Amplifier's inventory turns to 10+...  


Fred Sturm, President and CEO California Amplifier, Inc.

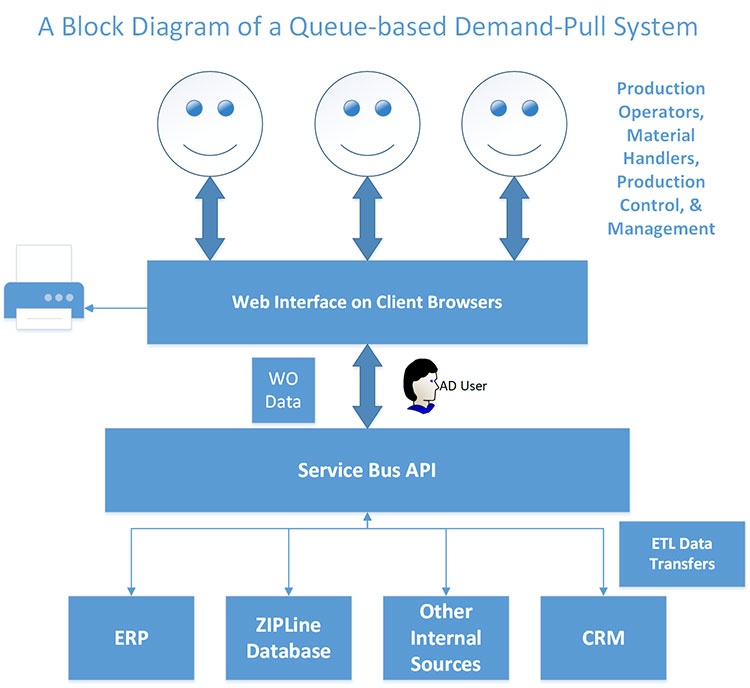
    The Figures below illustrate an embodiment of the demand-pull system, which can be implemented using a software system with a database.  In this embodiment, a .NET service bus and MSSQL database running on a networked Microsoft Windows server are connected via the local area network (LAN) to individual clients in the various WCs.  These clients contain the browser-based AngularJS user interface and connect with the service bus through its Application Programming Interface (API).

system architecture thumbsystem infrastructure thumb

    Likewise, other enterprise-level software applications (ERP, CRM and so forth) interface with the software implementation and can inject new WOs and extract data on those WOs as they flow through the factory.  The demand-pull system can include an Enterprise Resource Planning (ERP), Materials Resource Planning (MRP) or other similar system that creates WOs for parts to be produced by the factory.  This system should also be capable of storing the associated operation sequence (Workflow), the WCs associated with each operation in the Workflow, standard processing hours per unit (HPU) at each operation, and quantities of units (# Units) to be produced.  

    WOs and their associated data (Workflows, HPU, # Units, and Batch sizes, if applicable, at a minimum) are then introduced into the demand-pull system.  Initially, WOs have a Status code of "Pending" and when ready to begin production, the WOs are accepted into production through the demand-pull system user interface, which action changes the Status to “Open.”  When a WO is accepted, a time-stamp is created and it is “moved” to the Queue of the first operation in the Workflow.  This is the beginning of the "demand-pull" production process.

    When demand is detected at the next WC in the WO's Workflow, the WO is assigned a Pull Tag, which authorizes work activities at the first operation in its Workflow.  This "detection" can be based on an affirmative result to the aforementioned test in Equation 22:

equation 22

Where, in this case, N is the next WC in the WO's Workflow.  This test is done in the demand-pull system software through continuous polling of all WCs in the factory, as well as instantaneously any time a WO is Started or Finished at a WC.  In other words, when a WO is started into production at a given WC, the system immediately "looks" upstream for a candidate WO to refill its queue. Likewise, when a WO is completed and moved to its subsequent WC’s queue, a pull-test is performed both upstream and downstream to detect demand.   When a pull-test is performed on a WC, a record can be logged with a time-stamp and the order of polling of the WCs can be based on this time-stamp.  The WC with the oldest time-stamp can be polled first.  The polling frequency is a user-defined interval in the demand-pull system.

    All the parameters of the demand-pull system are tracked, or calculated (such as by the software) on each execution of the Pull-test.  The relevant parameters can include:

Database stored:
CN, tWO1, n-1, tT,N-1,N, CN-1, B, ON

Calculated:
XN, tR,N, tR,N-1, tQ,N-1, QN, YN, WN

    In addition, some of the calculated values are based on other parameters that are system generated or stored in the database.  

    Specifically:

    tR,N - is the remaining Clear Time for the WO in WCN with the least Clear Time remaining and is calculated as the difference between the Clear Time for the relevant WO in WCN and the elapsed time since the WO was started.  Therefore, the system captures the Elapsed Processing Time for each WO.  Then:  

    tR,N = Clear Time – Elapsed Processing Time

    Likewise, tR,N-1 is a similar calculation done on the WOs in WCN-1 to determine the remaining Clear Time for the WO in WCN-1 with the least Clear Time remaining.

    tQ,N-1 is the sum of the Clear Times for WCN-1 for all WOs in its queue that have been assigned a PT.  Since this calculation depends on the demand-pull system’s ability to determine which WOs have WCN as the next WC in their Workflow, the demand-pull system stores all the operations in the WO's Workflow as well as the sequence of those operations and their associated WCs. Then it stores in its database all PTs, their associated WOs and WCs so that it can identify the WOs that are UA to WCN and that have been authorized for production in their current WC (assigned a PT).  

    Likewise, YN relies on calculating its Clear Times for WCN and relies on the association of PTs.  This calculation knows that:
 
    a. a PT has been assigned to the WO; and
    
    b. the next WC in the WO's Workflow is WCN - so for that reason, the demand-pull system has stored all the steps in the WO's Workflow as well as the sequence of those steps.
 
    QN and WN are calculated on the basis of Clear Times, since no PT association is needed for these two values.

    A flowchart of the pull-system logic is shown inthe Figure below. Explanations of the terms used therein are found in the Table of Definitions.

flow chart w queue thumb


  • DCI Introduces Vortex Demand-Pull Technology +

    Since the early 1980's, the benefits of producing a given production volume throughput with the minimum amount of inventory have been well documented.  Beginning with the Just-in-Time methodologies, using Kanban cards for inventory replenishment, to Demand Flow methodologies,


    Read more
  • Vortex Introduction +

    The time-based demand-pull system (“demand-pull system”) technology of the described demand-pull system provides an implementation of demand-pull scheduling for various production operations/systems/factories.  It works in conjunction with a Material Resource Planning (MRP) or Enterprise Resource Planning (ERP) system, which creates production WOs and houses associated data, such as workflows and operational standard hours, to pull work through a factory with results similar to that of POLCA. 


    Read more
  • Production Priority-setting Examples +

        There are numerous methods of setting priorities in a production environment, too numerous to discuss in total in this paper, but some of the more prevalent methods are discussed below.


    Read more
  • First Authorized - First Processed Work Flow +

        When looking at work flow through a factory from the perspective of minimizing cycle time and honoring demand-pull policies, work should be processed on a first authorized, first processed (FAFP) basis. In other words, once a WO has been authorized within a WC’s queue, it should be pulled into production on a FAFP basis.  Deviating from this policy can result in an increase in the average cycle time, unless batching of WOs will reduce their aggregate cycle times due to machine capacity.  For an example of the latter situation, a machine may be capable of simultaneously processing ten pieces, and if there are two five-piece (or fewer) WOs, they could both be processed at the same time to reduce their aggregate cycle time, improve efficiency and maximize capacity.  


    Read more
  • Demand-Based Production from a Flow-Time Versus Need-Time Perspective +

    From a flow-time perspective, Work Orders should arrive in a Work Center's queue at precisely the time when they are needed to be worked on.  This minimizes both production cycle-time and inventory investment. The desired time for the next WO to arrive for processing is when the currently-authorized work in a WC and its upstream-adjacent (UA) WCs has been started into the WC and cleared the first operation in the WCs routing. This assumes that demand exists for the WO at the next downstream work cell.


    Read more
  • Examples of the Vortex Authorization Process +

    The examples set forth in the table below illustrate the WO authorization process resulting from the pull-test in different circumstances.  In all the examples, a set of WCs such as shown in the following Figure is used.  There are two WCs (WC 130 and WC 135) that feed into a third WC (WC 145) and the downstream WC (WC 145) is presumed to be healthy (reference the discussion of Work Center Performance Testing) so that the pull-testing for this WC is active. 


    Read more
  • Calculating Flow Time in a Work Center +

    Using Standard Labor/Machine Processing Hours
    In the case where all units in a WO are processed as a discrete set, the Flow Time of a WO in a WC is equal to the Standard Process Hours of the WO.


    Read more
  • Demand-Based Production from a Work-Volume Perspective +

    When looking at authorizing work in upstream stages of production, the traditional Kanban system establishes quantity buffers, or queues, at each WC. Then when the buffer quantity hits a minimum value (the Queue Policy), the Kanban card is returned to its originating WC for replenishment. 


    Read more
  • Table of Definitions +

    The following is a Table of Definitions for the articles describing the Vortex technology.


    Read more
  • An Optimum Queue Policy +
  • An Automated Demand-Pull System Embodiment +

    The Figures below illustrate an embodiment of the demand-pull system, which can be implemented using a software system with a database.  In this embodiment, a .NET service bus and MSSQL database running on a networked Microsoft Windows server are connected via the local area network (LAN) to individual clients in the various WCs. 


    Read more
  • Comparison of Time-Based Demand-Pull versus POLCA +

    POLCA (Paired Overlapping Loops of Cards with Authorization) is a prior art system to produce solutions to the application addressed herein, that is, demand-based shop floor control in a high mix, or high variety, production environment. 


    Read more
  • Vortex Shop Floor Control for Discrete Manufacturing +

    Is your manufacturing environment order-driven? Do you Engineer-to-Order or Customize-to-Order? Do your spaghetti diagrams look more like a network than continuous flow? If you struggle with production cycle-times that are too long and inventories that are too high, we have a solution!


    Introducing Vortex, a Shop Floor Control system designed to minimize your production cycle time and reduce inventory. Vortex works to pull production through your factory exactly when it’s needed! It predicts when a work center will be in need of more work, identifies the highest priority batch in all upstream work centers, and then authorizes the batch to be started just at the right time for it to reach the work center exactly when it is needed.


    Upstream work is only released if there is downstream demand, thus implementing one of the basic tenets of Lean Manufacturing – demand-pull production – in the high-variety, order-driven factory.


    Sounds simple, right?  In theory, yes.  However, if you’re talking dozens of work centers, dozens of different work flows and varying batches of sizes and flow times – predicting the time at which more work than is currently authorized for production will be needed can very quickly get complicated – the real-time calculations piling up pretty fast.

     
    Vortex streamlines the thousands of computations with a patent-pending algorithm, which works not only to synthesize all the math, but also integrate those solutions directly into your production system.


    Vortex’s modern, standards-based API is compatible with most ERP and Shop Floor Control systems.  The fully featured API allows your ERP and other internal systems to always stay up-to-date with the status of work on the shop floor. Vortex relies on your existing ERP system to create Work Orders according to your existing planning policies and inject them into the system through the API.  From there, Vortex handles the Starts into each work center based on demand-pull policies – minimizing both cycle-time and Work-in-Process inventories.  


    Check out our demo based on the following 5 products with individual work flows through 10 work centers. To view the demo, please click the link on this page - or drop us a line and we will take you for the tour.


    Read more